
The Inspection Before the Number
A guided route through the Statistics Field Guide before the dashboard gets believed.
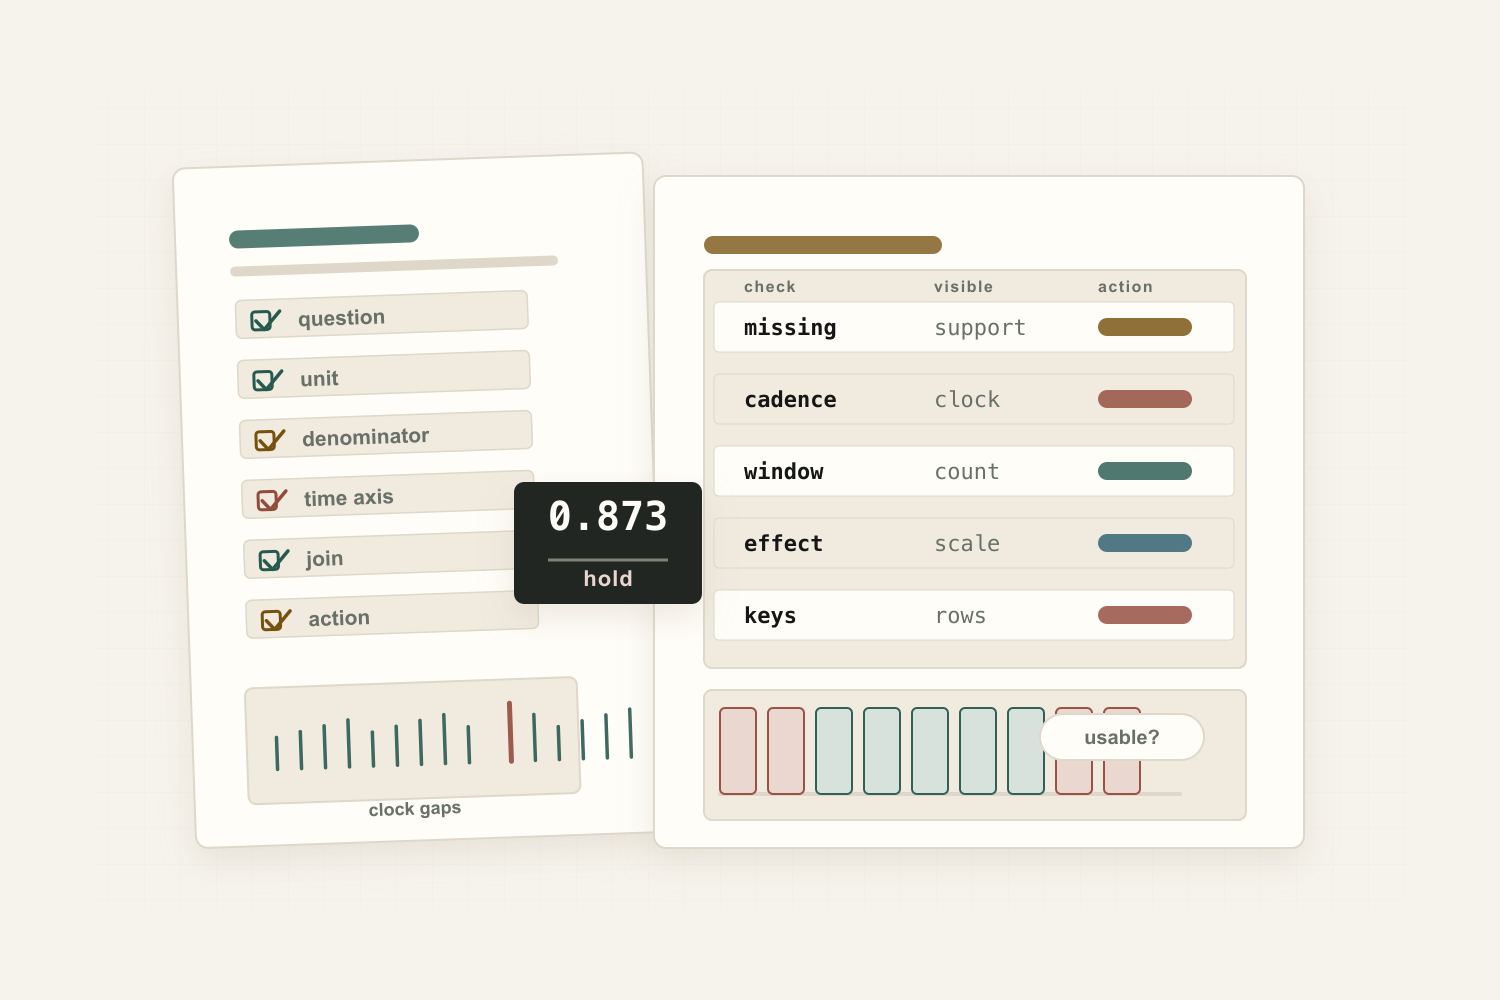
A dashboard can look finished before the analysis has begun.
The table is clean. The trend line has direction. The model score is reported to three decimals. The executive summary says conversion improved, churn rose, fraud declined, the detector degraded, or the segment is promising. Nothing looks obviously broken. The numbers are formatted, the axes are labeled, and the statistical machinery may even be correct.
That is the dangerous part.
A number can be correct without being useful. It can answer a question nobody should have asked. It can average across a veto. It can treat absence as indifference, row order as time, a join as clerical plumbing, or a named cluster as a discovered population. It can be produced by competent people using defensible methods and still fail as evidence, because the failure happened earlier.
Most statistical failures begin before calculation.
They begin when the question, unit, baseline, time axis, missingness mechanism, join, or decision boundary has not survived inspection. By the time the analysis reaches the fancy part, the decisive assumptions may already be embedded in the dataset. The arithmetic then becomes obedient. It will compute what it has been asked to compute.
The harder question is whether the computation deserves belief.
That is the subject of The Question Before the Number.
What follows is a guided on-ramp, and a practical route into the accompanying Statistics Field Guide.
The Field Guide is organized around a simple constraint: start with the analysis decision.
Not the formula. Not the package. Not the model family. The decision. What action could this diagnostic change? What claim is being supported? What unit of evidence is being inspected? What comparison makes the score interpretable? What uncertainty source matters? Where does the result stop being actionable? What should be inspected next?
That structure matters because diagnostics are often misused as miniature verdict machines. A low p-value, high AUC, tidy quality score, stable mean, or compact cluster can feel like an answer. But a diagnostic is a field instrument, not a verdict. It helps you see one failure mode under a declared boundary. It does not certify the whole analysis.

A good starting point is How to Read Diagnostics. The route is deliberately plain: name the decision, evidence unit, score, reference comparison, uncertainty source, action boundary, and next action. That sequence is not bureaucracy. It is how you keep a number from floating free of the thing it is supposed to inform.
From there, several entries are worth keeping close.

Missingness Rate sounds simple: what fraction of values are missing? But the useful version is support fraction under a declared denominator. “Five percent missing” is not yet a claim about safety. Five percent missing among all users, eligible users, active users, joined records, device-hours, transactions, or post-filter rows can mean different things. Missingness does not prove the missing support is fillable, ignorable, or harmless. Absence is a measurement problem before it is an imputation problem.
Cadence is another quiet source of error. Many analyses assume timestamps are good enough because a timestamp column exists. But lag analysis, rates, rolling windows, frequency analysis, and forecasts depend on temporal structure. Row order is not necessarily time order. Event time is not necessarily ingestion time. A dataset can have dates and still lack usable cadence. Time is not rows in a trench coat.

Window Feasibility asks a question that should come before many forecasting and detector benchmarks: how many usable windows do we actually have? Window geometry can leave too few examples, introduce future leakage, or create near-duplicate windows that make a benchmark look more stable than it is. Before trusting a detector, ask whether the evaluation frame produced independent evidence or merely a persuasive arrangement of overlapping slices.
Data Quality Index is useful only if its components remain inspectable. A composite score can help triage. It can also launder a catastrophic defect into an acceptable average. Components, weights, and veto rules need to remain visible. A tidy aggregate should not be allowed to bless a dataset that fails on the one property the decision actually needs. Never average away the veto.
K-means belongs in the guide for the same reason. It is not a ceremony for discovering natural groups. It is useful under compact Euclidean assumptions, after scaling choices and restarts are inspected, when the action can tolerate the geometry. A cluster is not real because it has a name. Naming is often where interpretation outruns evidence.
Effect Sizes provide another corrective. Statistical significance is not decision significance. A detectable difference may be too small to matter; a practically important effect may be uncertain because the evidence is thin. The question is not only whether a contrast can be detected, but whether its magnitude can change an action under the uncertainty you actually face.
And Key Integrity is a reminder that the join is part of the question. Entity resolution, duplicate keys, orphaned records, many-to-many expansions, and silent drops are not implementation details after the analysis. They determine what population the number describes. A metric after a bad join may be precise, reproducible, and wrong for the intended question.
The guide’s runtime labs are small by design. They are inspectable examples, not production certification. The decision guides are often prose-first because the useful artifact is not always a number. Sometimes it is a boundary. Sometimes it is a schema. Sometimes it is a component table, denominator declaration, veto rule, or next inspection.
This is the recurring discipline: before a number can become evidence, ask what question it answers, what the data made visible, and what should be inspected next.
That question is less glamorous than model selection. It is also where much of the work lives. The average will obey. The score will compute. The clustering algorithm will assign labels. The table will sort. The dashboard will render. The issue is not whether the machine can produce a number. The issue is whether the number remains attached to a defensible question.
For the argument in full, read The Question Before the Number. For the practical companion, open the Statistics Field Guide and start with the decision your analysis is supposed to change.